Detroit Economy Trending Toward Improvement [TRANSCRIPT]
Statistical index shows growth in income, labor, real estate and trade.


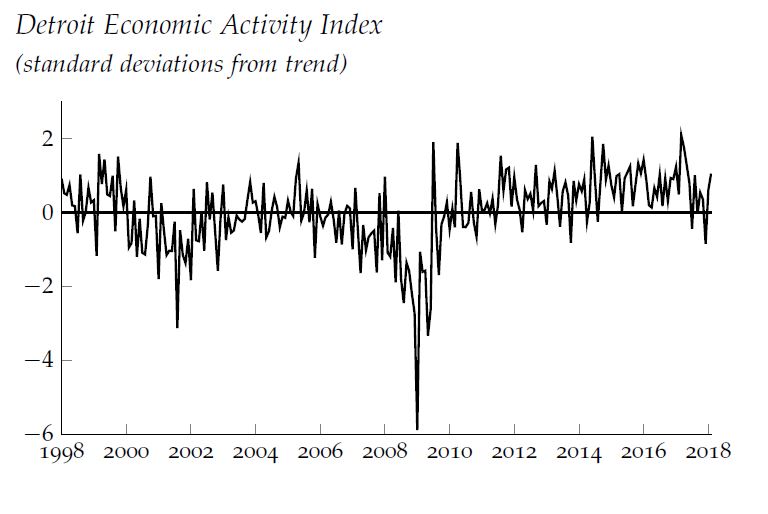
Detroit’s economy is improving, according to an index constructed from a combination of statistics from a variety of governmental and private sources.
The Detroit Economic Activity Index relies on a combination of data points to create one trend line about how Detroit is doing now relative to how it’s trended over time, says Paul Traub, senior economist with the Detroit branch of the Federal Reserve Bank of Chicago. The combination of statistics about income, employment, real estate, and port activity give one view of the city’s complicated economic status.
Traub and other co-creators first released the index about a year ago. The most recent update shows the continued improvement.
“It shows the city is rebounding,” Traub says. “It’s doing better at an increasing rate.”
DEAI Release, May 2018 by WDET 101.9 FM on Scribd
Traub spoke with WDET’s Sandra Svoboda. Click on the audio link above to hear the full conversation. Here’s a transcript:
Sandra Svoboda: What does your index show about how Detroit’s doing economically?
Paul Traub: So everything is based on trend growth. Right now the index is positive, quite positive, which would indicate that the city of Detroit is growing above its most recent trend so it’s very positive.
Sandra Svoboda: So there are four areas that you look at here. I want to go through each of them. Give me a little snapshot of what’s happening. The first one you look at is income.
Paul Traub: Yes. We’re showing income starting to move up. That’s going to be tied to what your next question is going to be about labor.
Sandra Svoboda: Let’s stick on income for just a moment. What are you seeing that has growth within that income category within the city?

Paul Traub: You’ve got more people working. Of course you’re going to have income growth based on that, but also you’re getting more tax revenue generation. So if you’re thinking about revenue for taxes, revenue for the city itself, that’s generating more revenue because you have more income tax coming in.
Sandra Svoboda: You foreshadowed my next question which is about the labor indicator. What’s happening in the job market in Detroit, according to your index?
Paul Traub: The job market is actually doing quite well. It’s moving up. It’s a two-edged sword. A lot of people talk about unemployment rate, and so if you look at the unemployment rate it’s moved up to slightly about 9 percent. If you compare that to the nation as a whole, it’s more than twice what the nation is doing. However it was down in the 7 percent range about six or eight months ago, so that’s indicating to me that you’re probably getting more people back into the labor force because the unemployment rate is a function of the number of people unemployed divided by the number of people looking for work. It’s indicating to me that you’re starting to see people come back into the labor force.

Sandra Svoboda: The third category that you look at in this index of Detroit’s economic activity is real estate. There’s a lot going on in real estate these days in the city.
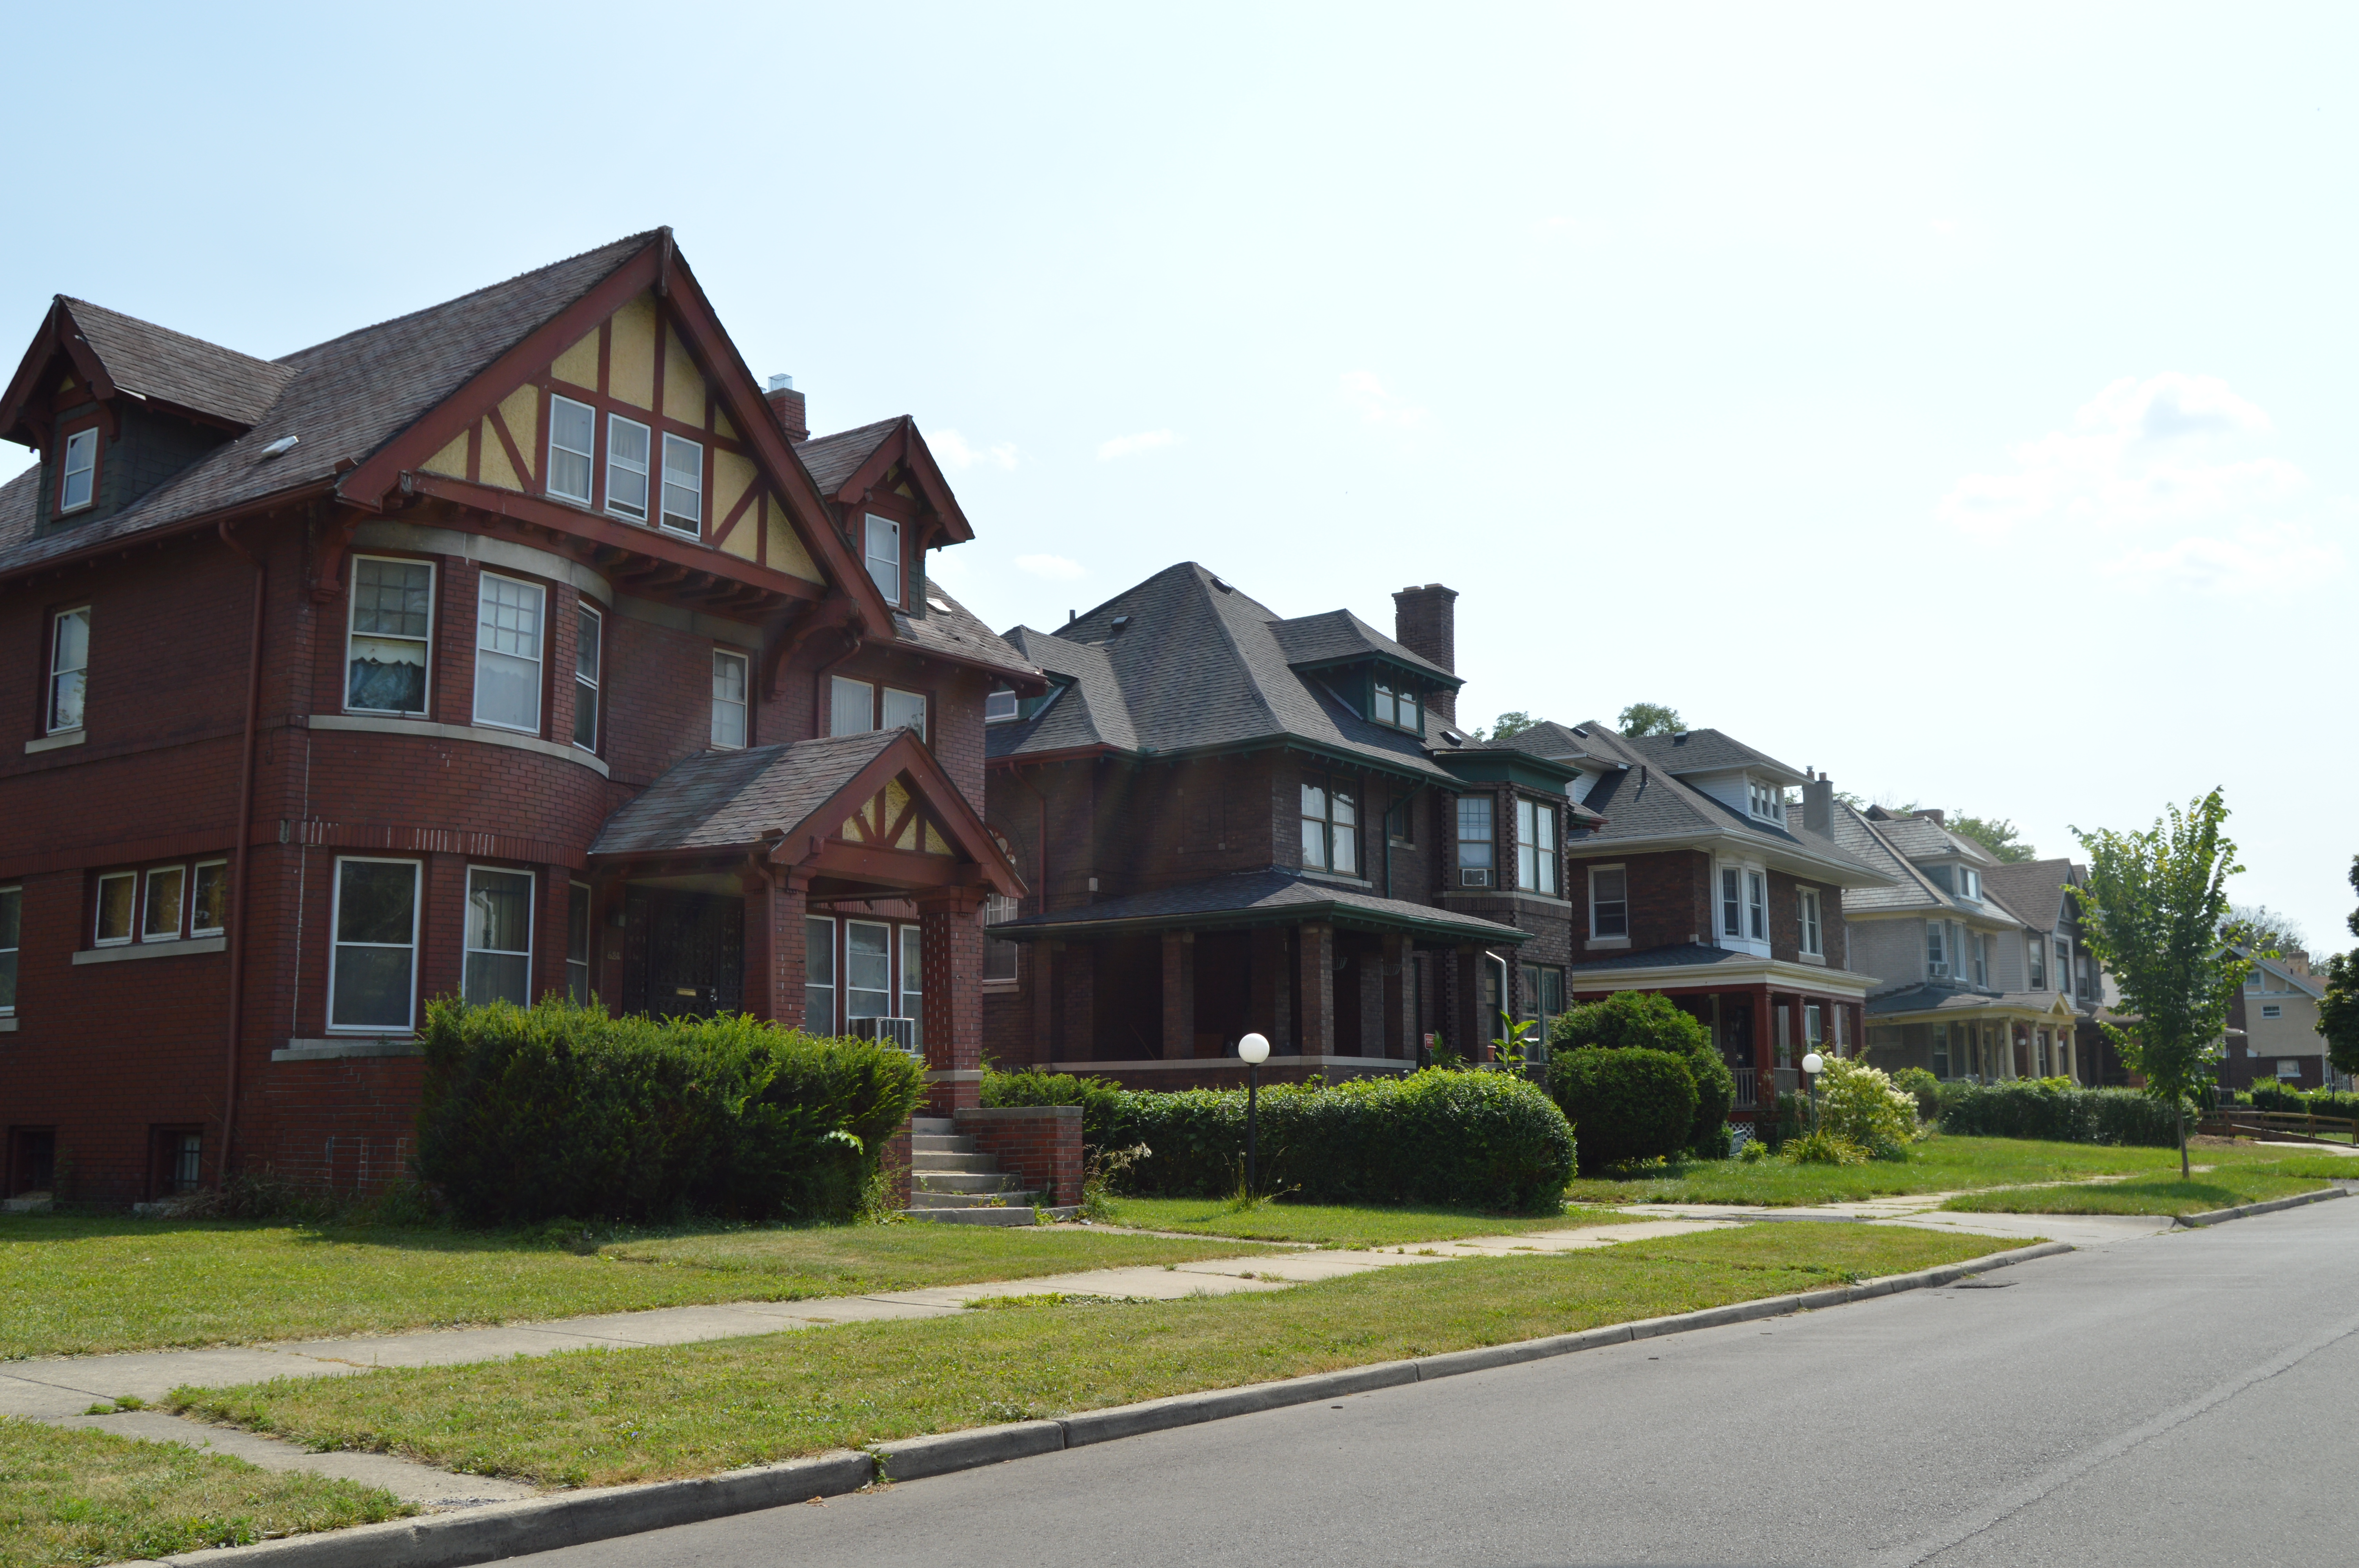
Paul Traub: Real estate is quite dynamic. It depends on where you are in the city. So as we all know, where the investment is, we’re seeing home prices rise quite dramatically. It’s also a function of single-family versus multi-family homes and condominiums. So in the index I track condominiums and single-family homes. You’re seeing down around the Woodward Corridor, down in the heart of the city, prices in condominiums and homes in those areas growing quite rapidly. That’s starting to show up more in the east side. The projects on the east side to fix East Jefferson. They’re going to make East Jefferson more public friendly, draw people closer to the river and those types of things. That kind of investment is showing up in the home prices.
Sandra Svoboda: And the final category that you look at in your statistical index is trade. How are you measuring trade in the city, and what’s it showing?

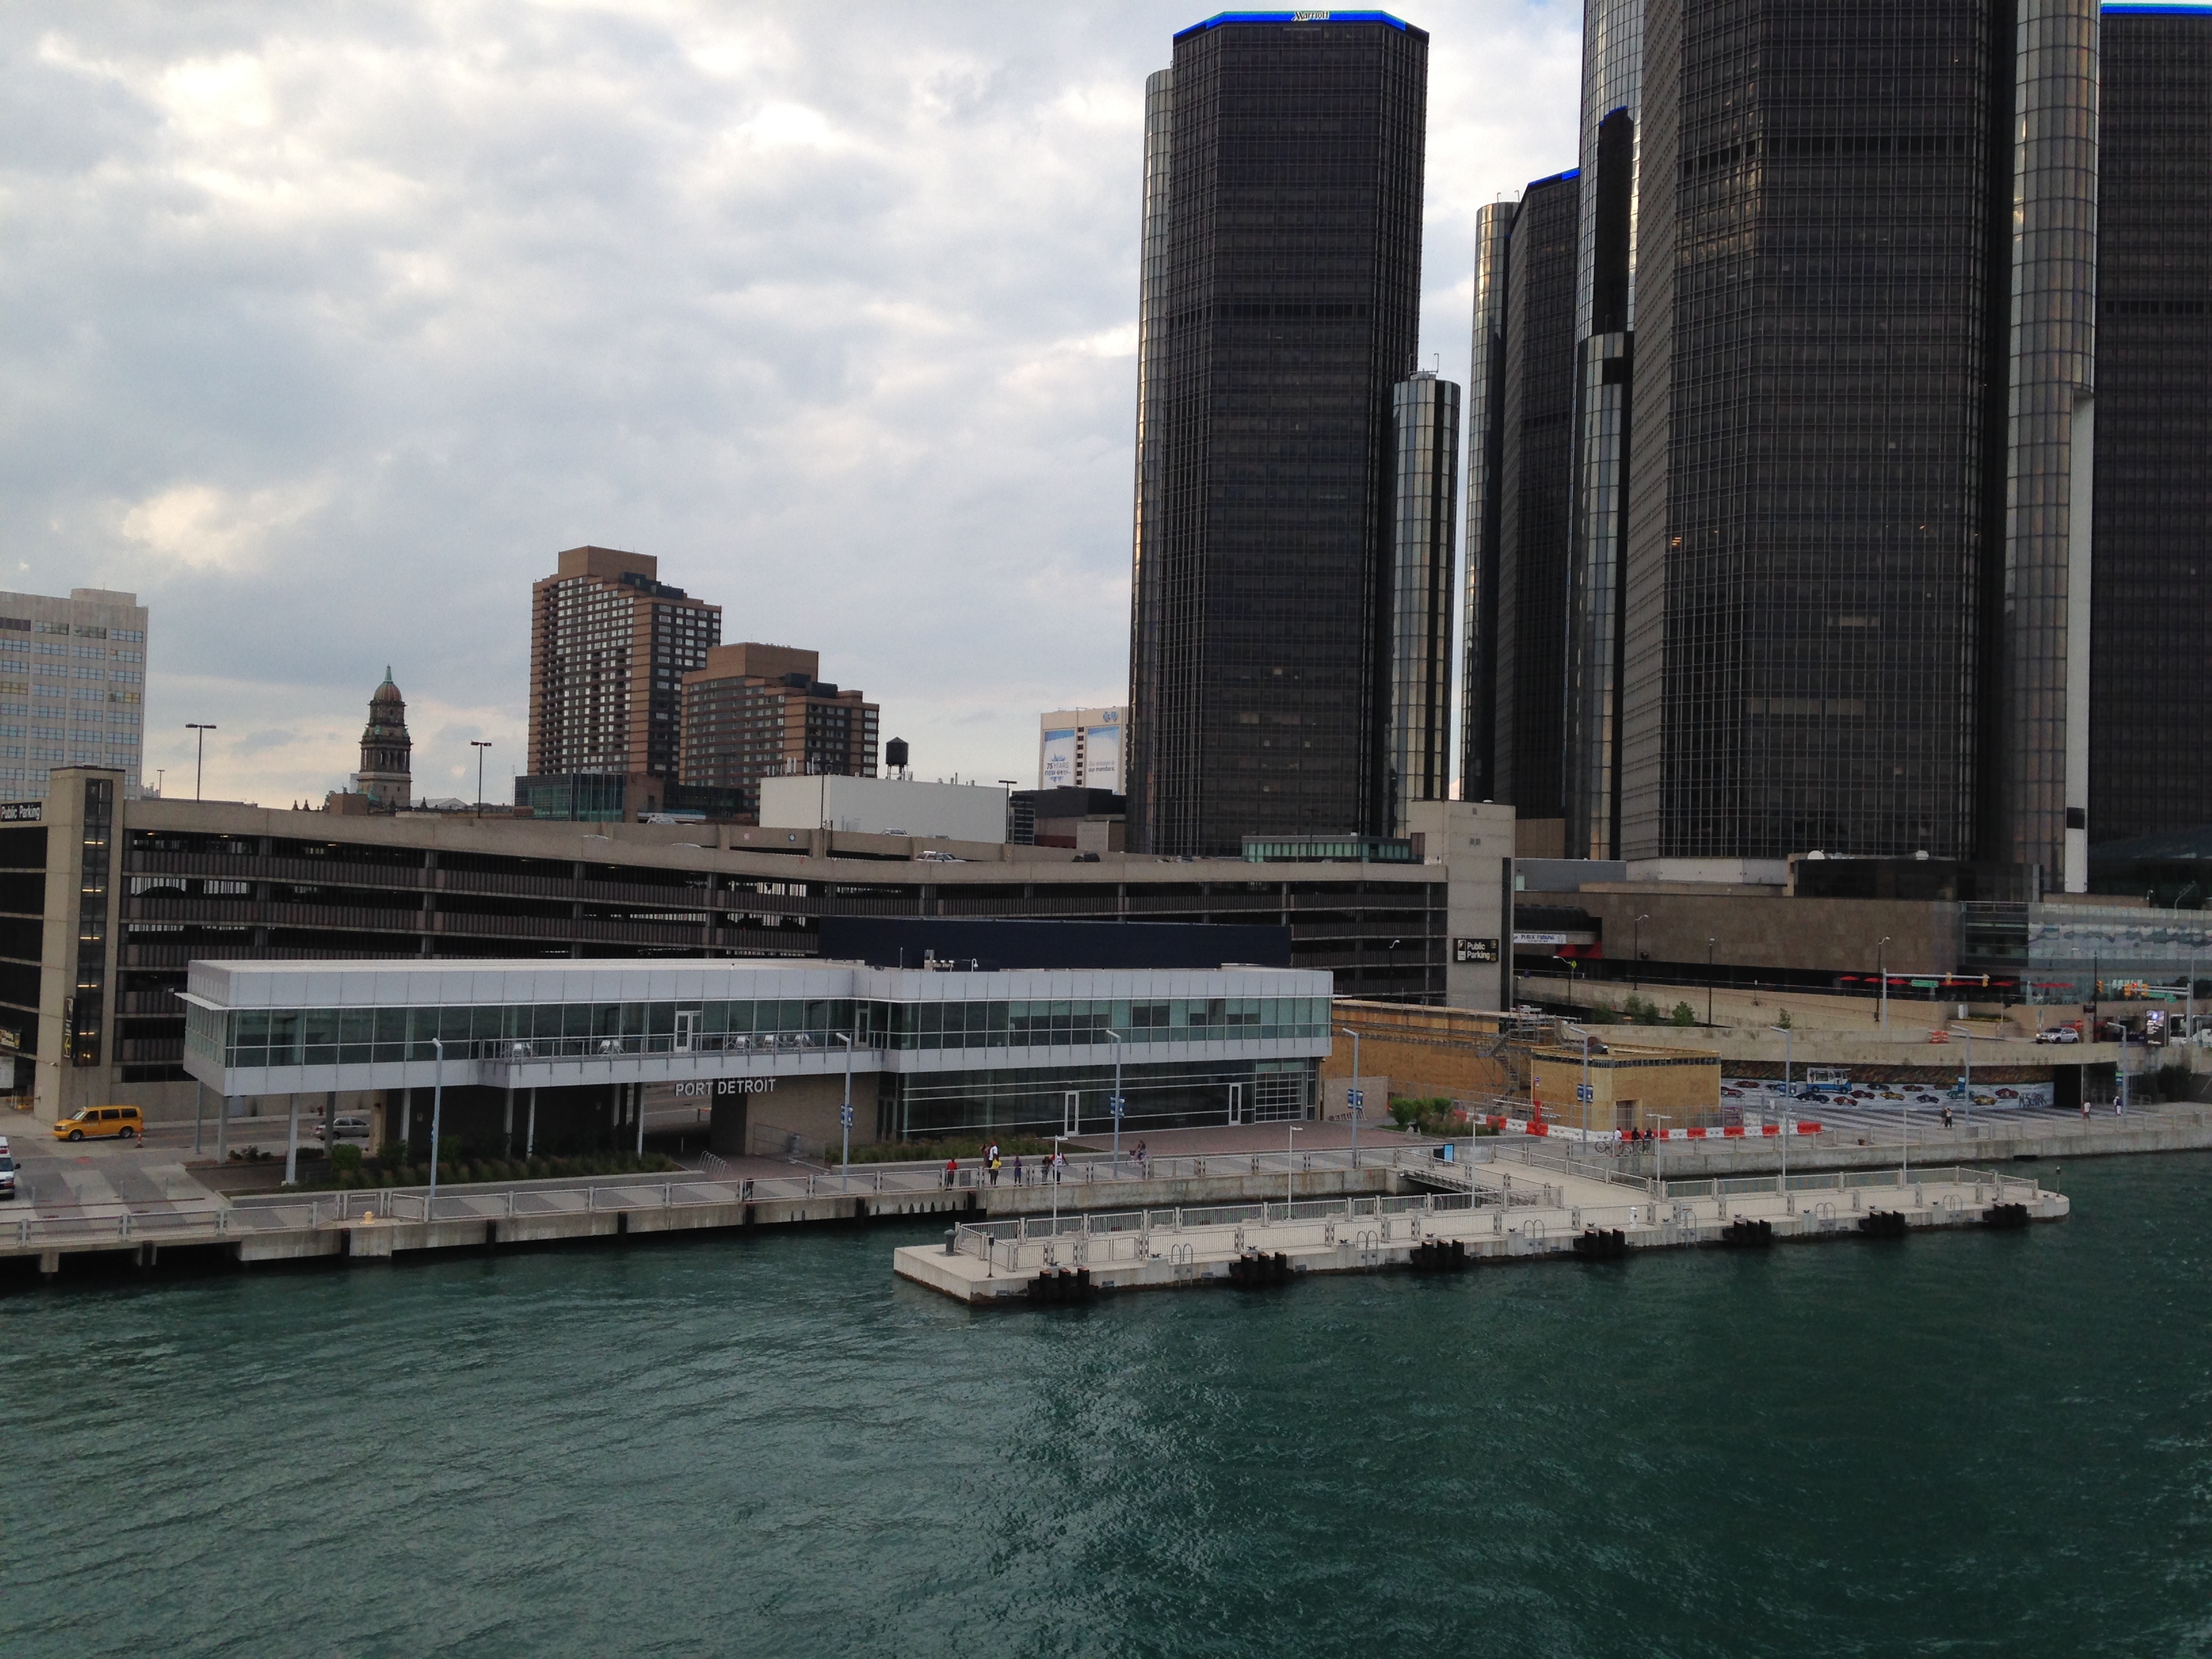
Paul Traub: Well, the trade is the port activity out of the city. We have a Detroit port so what we’re looking at is how well is that port activity handling. Of course, that’s logistics. That means trucks coming in, that means people using the port. So it’s not just what’s made in Detroit and exported from Detroit. But it shows that activity in the area is doing well. When you have good port activity, that means the city is benefitting from that.
Sandra Svoboda: How do all these indicators combine to give us a snapshot of what’s happening in the city now?
Paul Traub: It’s a diffusion index in nature. The concept of the index is I don’t know what gross domestic product is for the city. It’s kind of a dynamic factor model in that we measure indexes. We know that if employment is doing well, income is going up, the economy must be doing better. These particular statistics that are all put into the index then are measured kind of like a diffusion index: Are we growing or are we shrinking over a period-by-period basis? Then the 23 or so different indicators are measured based on the long-term trend, are we growing faster or slower than trend? Anything positive means you’re growing faster than trend, and anything negative would either mean you’re growing at trend or slightly below trend.
Sandra Svoboda: What’s missing from this index?
Paul Traub: It would be nice to have data more frequently. What’s happening in income tax receipts, what’s happening in those types of things? Really what we have is the best that we can get. The frequency of the data is somewhat slowing us done or keeping us from doing this on a more regular basis.
Sandra Svoboda: What data sources are you using? These numbers aren’t all coming from one source.
Paul Traub: Companies in the area. We also talk to different business people. Some of the data is coming from companies in the real estate sector. A company called Realcomp is providing us with actual home sales data. We have other suppliers of information that provide us with other real estate data. We have DTE providing us snapshots of residential and commercial electrical customers. We’re getting data from a broad scope of areas. Of course, if someone out there has data they want to share with us, we’ll be happy to take it.
Sandra Svoboda: Are you using governmental sources, the federal government or down to the city’s open data portal?
Paul Traub: We use BEA-types of data.
Sandra Svoboda: BEA?
Paul Traub: Bureau of Economic Analysis. We use the data from them. We use Census bureau data. Some of that data is surveyed so it’s weighted data. Unemployment data comes from the Bureau of Labor Statistics, so there’s a lot of different government sources of data also.
Sandra Svoboda: You’ve been working on this index now for about a year. What potential does it have for people making decisions in business or in government or education sectors in the city?
Paul Traub: It really could be used in a lot of different ways. One of the big things I think is when you try and talk about the city’s success, how well is the city doing? If you’re trying to draw investors into the city, you’re trying to get people that are willing to come here and work, are looking for jobs, I think an index like this, it shows the city is rebounding, that it’s doing better at an increasing rate. Those kinds of things, I think, could be used when you want to show how well or spotlight the city’s success over the last few years.
