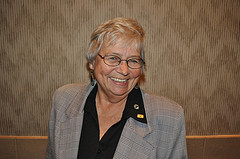
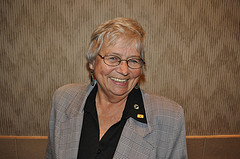
Meet Eastpointe Mayor Suzanne Pixley
How much do you know about the city of Eastpointe?

You always just go with the flow, Detroit is a wonderful city.”
-Suzanne Pixley, Mayor of Eastpointe
Born and raised in Eastpointe, Suzanne Pixley is not only the mayor of the city, but also an author. She writes books about the city’s people and history.
Pixley sits down with Stephen Henderson to talk about Eastpointe’s past and how it is changing with modern times. Click the audio link above to hear about:
- How Eastpointe was affected by the decline of the auto industry. Even though many of the city’s residents experienced the pain of layoffs, many of them are returning to the city.
- Pixley’s efforts to stay involved in Detroit and how her own history has kept her believing in Detroit.
- Why young people are finding out that Eastpointe is an attractive place to live.
Click on the audio link above to hear the full conversation.
Where is Eastpointe?
About Eastpointe
County : Macomb
Population : 32,627 (ACS 2013)
Median Household Income: $43,207 (ACS 2009-13)
Poverty Rate: 22.6% below poverty. 11.6% White, 36.9% African American, 34.3% Asian, 59.5% Other (ACS 2013)
Crime:
Total 1,467, per 100 residents 4.5
Violent 296 , per 100 residents 1
Property 1,171, per 100 residents 3.6
Chance of being a victim in Eastpointe: 1 in 110
Chance of being a victim in Michigan: 1 in 222
(Neighborhood Scout 2014-15)
Education:
High School graduation rates:
East Detroit Public Schools 71.2%, South Lake Schools 89.54%
(mischooldata.org 2013-14)
General Fund Revenue: $15,771,921 general revenue
(Munetrix 2015 budget)
Transportation (commutes): Drove Alone 83.9%, Carpool 8.4%, Public Transit 1.7%, Walk 1.9%, Other 1.1%, Work from Home 3.1%
(SEMCOG 2010)
Jobs: 7,856 total
Top Sectors: Services to Households and Firms 2,920, Retail Trade 1,104
(SEMCOG 2015)
Race: White 56.7%, African American 37.4%, American Indian/Alaskan Native 0.2%, Asian 1.5%, Hispanic/Latino 3.1%, Multi-Racial: 2.9%
(SEMCOG 2013)
Diversity Index: 0.36 on a scale of 0, least diverse to 1, most diverse

