
How’s Detroit Doing? New Statistical Index Offers Answers [CHARTS, TRANSCRIPT]
Combining income, employment and real estate data creates better picture of city’s status.
Economists are using a new combination of statistics and measures to create a better picture about how Detroit is doing.
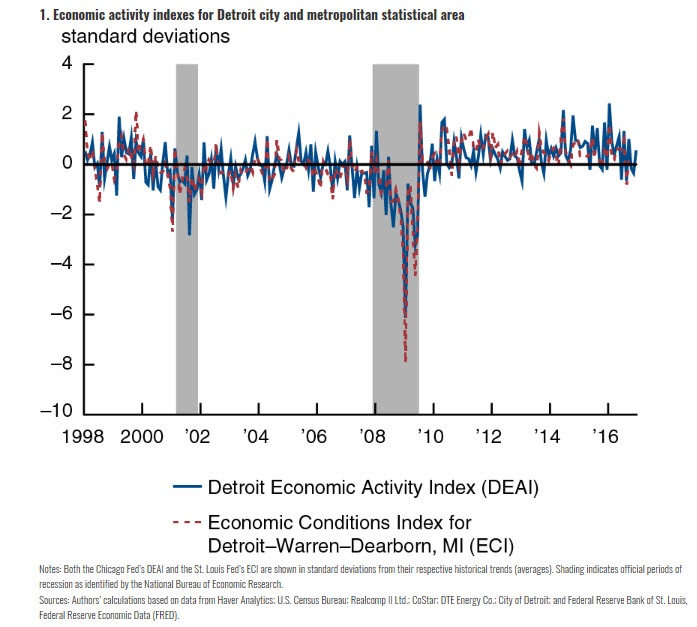
Unlike some reporting metrics, the “Detroit Economic Activity Index” relies on a combination of data points, says Paul Traub, senior economist with the Detroit branch of the Federal Reserve Bank of Chicago. The idea is to move from snapshot to mosaic.
“It’s a broad spectrum of the city as a whole,” Traub says. “The index shows that Detroit is recovering fairly well post-bankruptcy.”
To hear the full conversation, click on the audio link above. The full transcript is below.

Sandra Svoboda: What does your new index tell us about How Detroit is Doing?
Paul Traub: The index shows that Detroit is recovering fairly well post-bankruptcy. What the index was designed to do was to try to quantify Detroit’s recovery. We’ve heard a lot about improved investments and higher employment and rising incomes, so we wanted to see how we could quantify that so we put together the index to do that. It’s a mixed-frequency dynamic factor model that takes everything on the right and makes a number on the left, if you can understand how that works.
SS: So let’s talk about what goes into some of those numbers. What factors are you looking at?

PT: We’re trying to capture income, employment, residential and commercial real estate. We use electric customer counts, tax revenues and even port activity in the city of Detroit.
SS: And how do those come together to give us an indication of how the city’s doing?
PT: Well the index is set up to trend everything to some point over time. Then what we try to do with the index is if it’s growing greater than trend, the index comes out on the other side, it’s showing that you’re getting economic activity greater than trend over time. If it’s less than zero then you’re getting an activity that’s less than trend over time.
SS: Why didn’t this index exist before?
PT: It did in some sense. The Federal Reserve Bank of St. Louis had one that used a Metropolitan Statistical Area and that is not necessarily Detroit-specific data. It had 12 indicators. We use 23 separate Detroit-specific data points.
SS: So where is Detroit is improving and where is it maybe needing more work?
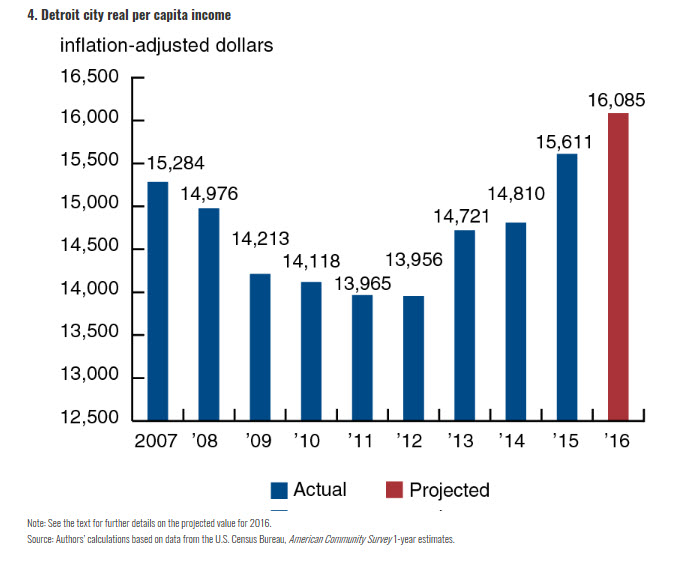
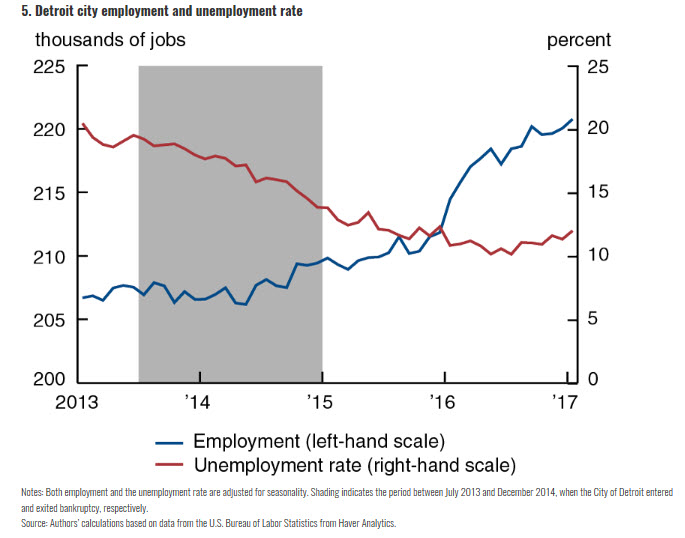
PT: It’s improving pretty much across the board but the area that’s getting the heaviest weight in the model is, of course, the employment side. Unemployment rate is down. Participation rate is up. Employment jobs are being created. We’ve added about 11,000 jobs in Detroit just since the end of the bankruptcy. So we’re seeing that kind of activity which is showing up really well. The other area is, of course, property values but property values in specific areas of Detroit, not across the 140 square miles.
SS: Are there both strengths and weaknesses to doing an index, which kind of combines a lot of different statistical measures?
PT: The strengths are you get something that’s quantifiable. You can sit down and look at something and compare it to periods in time. We go back to 1997. The weaknesses are how much data you can get, how frequently you can get the data and how accurate that data is. It’s subject to revisions over time.
SS: What conditions and data about the city does your index not show?
PT: What it doesn’t pick up on, it’s a broad spectrum of the city as a whole. As I said earlier, you’re not getting pockets of the city which aren’t seeing the recovery like we’re seeing down the Woodward Corridor where property values are growing, there’s a lot of investment, and a lot of business activity. So what it doesn’t show is where we’re missing out on property values in some areas of the city. It doesn’t point to what’s happening with safety in the city, what’s happening with services in the city. So there’s areas that the index just doesn’t quantify. It just quantifies numerical things that the model can get its head around.
SS: How can this index be used?
PT: My biggest hope was for policymakers to see how investment is really driving the city. In areas where we’re seeing heavy investment, we’re seeing real strong growth. My hope was that for policy makers they can look at how they want to spread their dollars around the city, spread their money so they can get a better recovery across a broader area of the city.